
Introduction
X-Ray Diffraction (XRD) applied to mineral processing
Most of the minerals (valuable and gangue) found in ore bodies are crystalline. Knowledge of chemical composition and crystalline structure is essential for process metallurgists in optimizing process conditions to get maximum recoveries of value minerals, eliminate or minimize penalty elements (eg. Arsenic, Antimony etc.), regulate environmental safety and also mine planning. Thus, accurate identification of minerals followed by understanding its crystalline properties is important in making critical business (financial, economic and operations) decisions. XRD is considered as a gold standard technique for mineral characterization as it provides a wealth of information within a short duration. The information obtained includes but is not limited to: phase identification and quantification in single and polycrystalline materials, crystal hardness, morphology and further unit cell parameters, all of which provide valuable atomic level information. This information is then used by mine geologists and process metallurgists in understanding and making recommendations on ore bodies and optimizing process conditions during various stages of mineral processing operations.
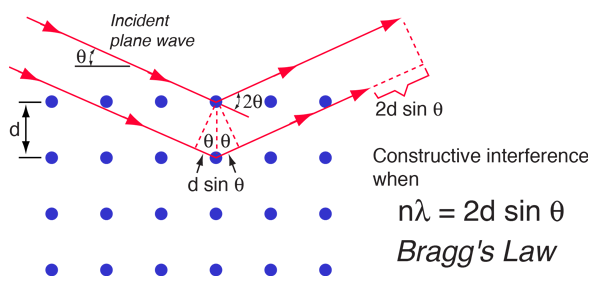
Although X-rays were discovered by Laue in the early part of the 18th century, it was the pioneering work of Sir Lawrence Bragg and his father Sir William Bragg that led to the foundation of modern crystallography. Bragg’s law gives the relationship between wavelength and atomic spacing within a crystal lattice. Bragg observed that when X-rays shine on a crystal lattice, maximum scattering occurs at a particular angle called the diffraction angle (Figure 1). He then established a mathematical relationship between the wavelength of X-rays, crystal lattice spacing and diffraction angle which is now known as Bragg's law (Eq. 1).
| n𝜆 = 2d sin𝝧 | Eq. 1 |
Where 𝜆 is the wavelength of the X-ray, d is the crystal lattice spacing, 𝝧 is the diffraction angle and n is an integer.
Experimental
Sample preparation
Generating a high quality XRD output requires utmost care in sample preparation. Ore specimen size of a few milligrams to grams is all that is needed for XRD analysis. The sample is ground with mortar and pestle to break down the bigger particles into particles of smaller size in the range of 10 to 30 microns. Care must be taken, however, given that excessive grinding can lead to generation of material of amorphous phase, destruction of crystal structure and, in some cases, even transition into other phases.
Instrumentation
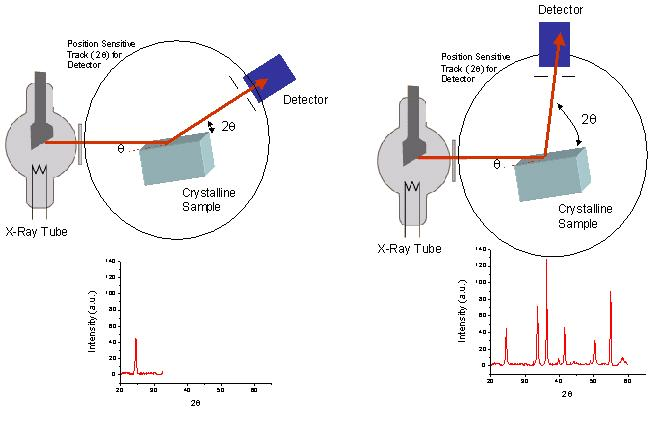
Figure 2.1 shows the basic layout of the XRD instrument. It consists of 4 parts: X-ray source (typically Cobalt (Co) X-ray anode), sample holder, detector and goniometer. XRD comes in two modalities: reflection and transmission. For mining applications reflection modality is more common. A plot of scattered intensity is generated at various angles However, for mining applications reflection geometry is preferred due to heavy metals present in the ores.
Reference: ASDLibrary
XRD Analysis
Qualitative and quantitative XRD
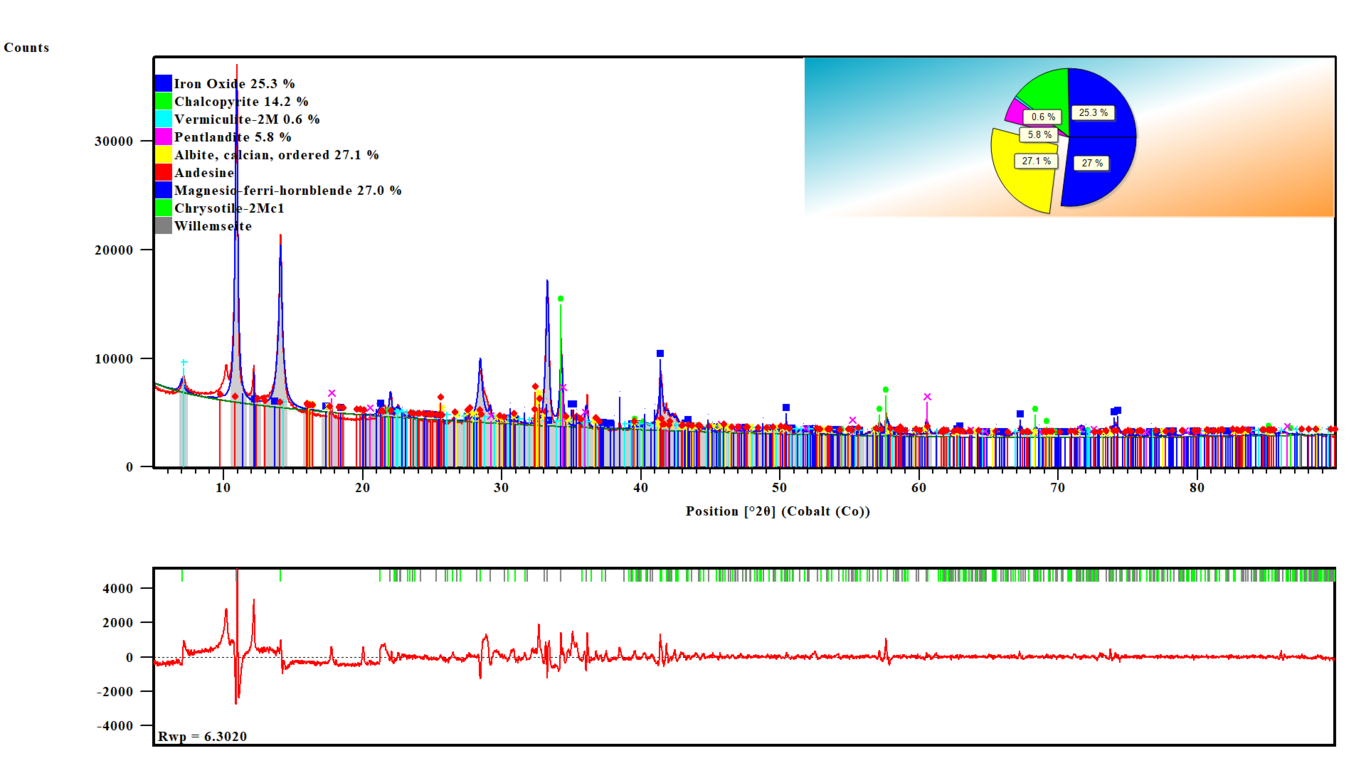
XRD provides identification, quantification and mineral structure information of all crystalline minerals present in a mineral processing stream (eg. ore body, milling circuit, flotation circuit etc.). A single XRD scan simultaneously gives information about several different minerals present in a given specimen. This is made possible by the following facts: a) Each mineral has its own unique XRD pattern by which it can be identified; and,b) patterns of individual mineral phases are additive. Therefore, all information of individual crystalline materials is retained in an XRD scan of a polycrystalline specimen. Figure 3.1 shows an example of an XRD scan of a mineral ore sample in which many different minerals are present. The individual minerals phases have been identified by comparing the scan with known mineral phase patterns in XRD databases (eg. International Center for Diffraction Data, ICDD). Once the mineral phases are identified, quantitative mineralogy, i.e. determination of their relative quantity in the sample, is computed using the Rietveld refinement method with the help of mineral structural information contained in the database1. The quality of Rietveld refinement is measured from the difference plot shown in Figure 3.1.
Principal Component Analysis (PCA)
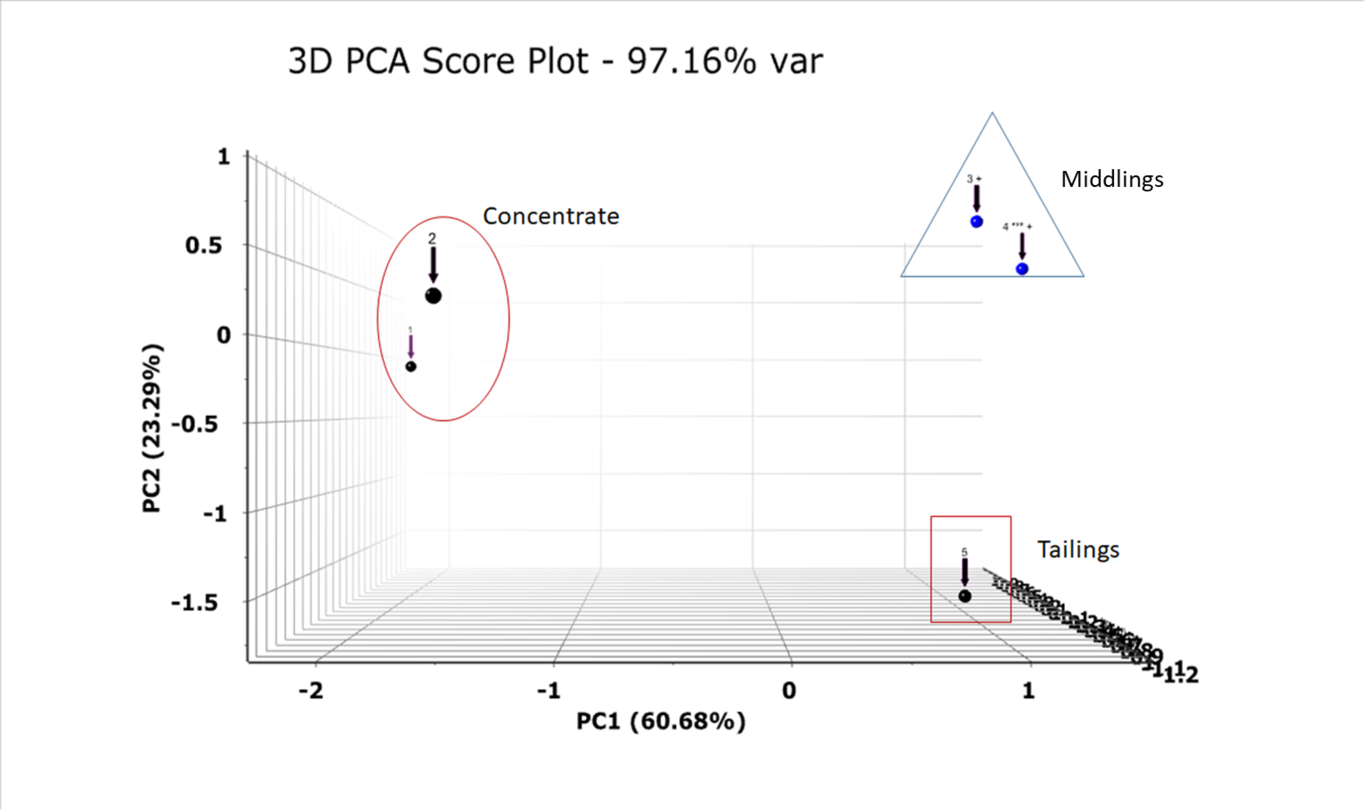
Nowadays, XRD software includes data analytics techniques, such as principal component analysis, which allow for rapid clustering or classification of sets of XRD scans based on similarity. The similarity between scans, in turn, stems from similarity in mineralogical composition of the samples analyzed, a property which can be inherent of the samples (e.g. two or more drill core samples representing ore zones of similar constitution), or brought about by processing of a given flotation ore feed (as in the case of flotation where two or more reagents generate concentrates of similar composition). The clustering (or classification) itself helps to quickly visualize both similarities and dissimilarities between samples, where it can be applied, for example, to track the mineralogical variation in a flotation plant’s ore feed samples, study the effect of different flotation chemistries on a given ore or set of ores, etc. Simply speaking, principal component analysis results in reduction of the dimensionality of a set of data to only a few dimensions which capture most of the variation in said data. Out of these fewer obtained dimensions, called principal components, typically the first few are retained, normally three, and the rest are discarded (N-3 in number, where N is the number of dimensions in the data). The three components are usually referred to as PC1 (for Principal Component 1), PC2 and PC3, where PC1 captures the largest variations in the data, PC2 the second largest and so on. The three components are also orthogonal, that is to say, variations in the data along one PC direction are uncorrelated to variations in the data along the other two components (further details are outside of the scope of this document but can be found in elsewhere2). As an example Figure 2 below shows the outcome of a flotation experiment wherein after the first two cons, the mineralogy is changing significantly (60%) between concentrate, middlings and tailings. Concentrate samples (1,2 in Figure 4) have maximum variation (PC1, 61%) when compared to Middlings (3,4) and tailings (5). Variation between middlings and tailings is 23% (PC2). Further, analysis showed concentrates are more rich in copper minerals whereas middlings are more contaminated with gangue minerals. This indicates how the kinetics of flotation is progressing throughout the separation and can provide a quick guiding tool for an operator to make the appropriate reagent dosage adjustments for optimal metallurgical outcome.
Limitations of XRD and Validation of Results
- XRD is a bulk technique and gives information about bulk and major minerals present in the rock. Information about locked and surface minerals, which is necessary for flotation performance, cannot be obtained. This information can be obtained by complementary techniques such as MLA, SEM-EDX.
- XRD is only for crystalline materials. Certain clay minerals are soft and can easily lose crystallinity during sample preparation. Near Infra-red (NIR) spectroscopy is a method of choice for such samples.
- Instrument requires special accessories, such as compressed air and heat sink for an X-ray tube, which limits its use in laboratory settings. However, this situation is changing with advances in technology where instrument manufacturers are making benchtop and onstream XRD.
- While XRD remains a standard analytical technique for mineral characterization, final results remain lab dependent. Proper method development requires some experience, validation with complimentary analytical techniques (eg. XRF, ICP, NIR etc.) and some knowledge of the samples.