
Introduction
Near-infrared (NIR) spectroscopy applied to mineral processing
The remote sampling capabilities of NIR spectroscopy enables noninvasive, rapid characterization of hydroxyl (i.e. clays) and iron containing minerals.1-3 Since water exhibits a moderate, interference in the NIR spectrum, the ores should be dry. Typically such analyses characterize the ore upstream of the mineral processing steps. Sampling points for the NIR analyses include crushed ore on conveyor belts, drill core samples, portable NIR spectrometers at various mine site locations and satellite imaging of the entire mine site. 4-8
Principles of NIR spectroscopy
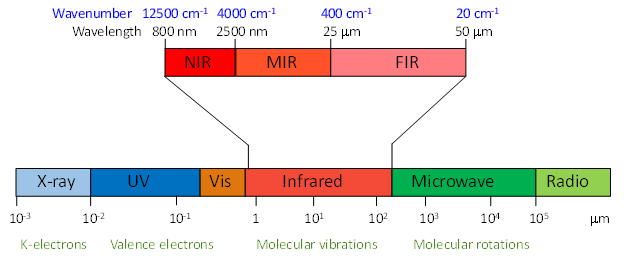
Near-IR (NIR) spectroscopy is based upon molecular overtone and combination vibrations which derive from fundamental molecular vibrations. The NIR spectral region is found in the 800-2500 nm spectral region (see Figure 1). Under the quantum mechanical harmonic oscillator approximation the overtone and combination are forbidden by selection rules but occur due to the intrinsic anharmonic nature of most molecular vibrations. As a consequence, the molar absorptivity in the NIR region is typically quite small and the groups involved include the X-H groups such as C-H, O-H and N-H containing species that are prevalent in organic molecules. NIR spectroscopy also exhibits excellent specificity for clay (gangue) minerals because of the distinct and strong bands associated with the Al-OH, Mg-OH and Fe-OH functional groups. However, the NIR technique is poor for identification of silica, sulfides and sulfates.
NIR bands are typically very broad and overlapping due to multiple combination/overtone vibrations. Both the band positions and peak shapes are dependent upon the local environment of the functional group (such as Mg-OH). This typically includes amorphous versus crystalline state, crystalline structure and material temperature. The resulting NIR spectra are often complex and it can be difficult to uniquely assign spectral features to specific chemical components. Because of this, multivariate analysis tools (i.e. chemometrics) are typically used to develop empirical qualitative and quantitative models.
Positive features of NIR spectroscopy include simple sampling, uncomplicated instrumentation, low cost and rapid results. However, NIR requires significant method development time involving a statistical correlation (chemometrics) with primary analytical methods. Using sophisticated software, the analysis model is trained to identify which spectral features are definitive for a sample. For mineral applications these analyses models are typically already developed by the vendor. Once a multivariate based method is developed, accurate qualitative and quantitative information can be obtained by relatively untrained personnel.
Experimental
Reflectance based NIR sampling provides a measurement of the mineral surface rather than the bulk material. There is no physical contact between the sample and the instrument as well as no sample handling. In general, these instruments can perform well outside a climate controlled lab. The measurements are rapid (< 2 sec) and include either a simple small spot measurement of an individual sample, a wider field measurement on a moving conveyer belt, or a larger scale imaging of a mine site itself (satellite, plane or drone based). The wider scale measurements of heterogeneous mineral ore sample employs hyperspectral imaging.
Sample preparation
Good quality NIR reflectance spectrum can be measured of exposed rock face, drill core samples and ground rock particles. There is a particle size effect on the measured reflectance NIR spectrum where particles < 0.1 mm tend to have a weaker signal. Since water is a moderately strong NIR absorber, the mineral samples should be dry.
Instrumentation
Ruggedized, portable vis-NIR instrumentation suitable for field environments are available from multiple vendors for mining applications.9, 10 The NIR spectrometer technology has benefited from significant developments of sensitive detectors as well as high performance miniaturized dispersive systems. Imaging systems utilize an imaging spectrometer interfaced to a two-dimensional array detector. In general such spectrometers utilize both the visible and NIR spectroscopic range (~400-2500 nm).
| Application | Sampling | Source | Wavelength | Diffraction-Detection |
| Hand held portable | Contact | Halogen lamp | Vis-NIR | MEMS DLP/CCD-InGaAs |
| Portable | Fiber optic-remote | Halogen lamp | Vis-NIR | VPH grating/ CCD-InGaAs |
| Conveyor belt | Remote | Halogen lamp | Vis-NIR | VPH grating/ CCD-InGaAs array detectors |
| Satellite | Remote | Ambient | Vis-NIR | High res grating/CCD-InGaAs array detectors |
Sensitivity
For NIR active chromophores such as clay’s and iron containing species, the mineral species should be greater than 0.5 weight percent.
Data Analysis
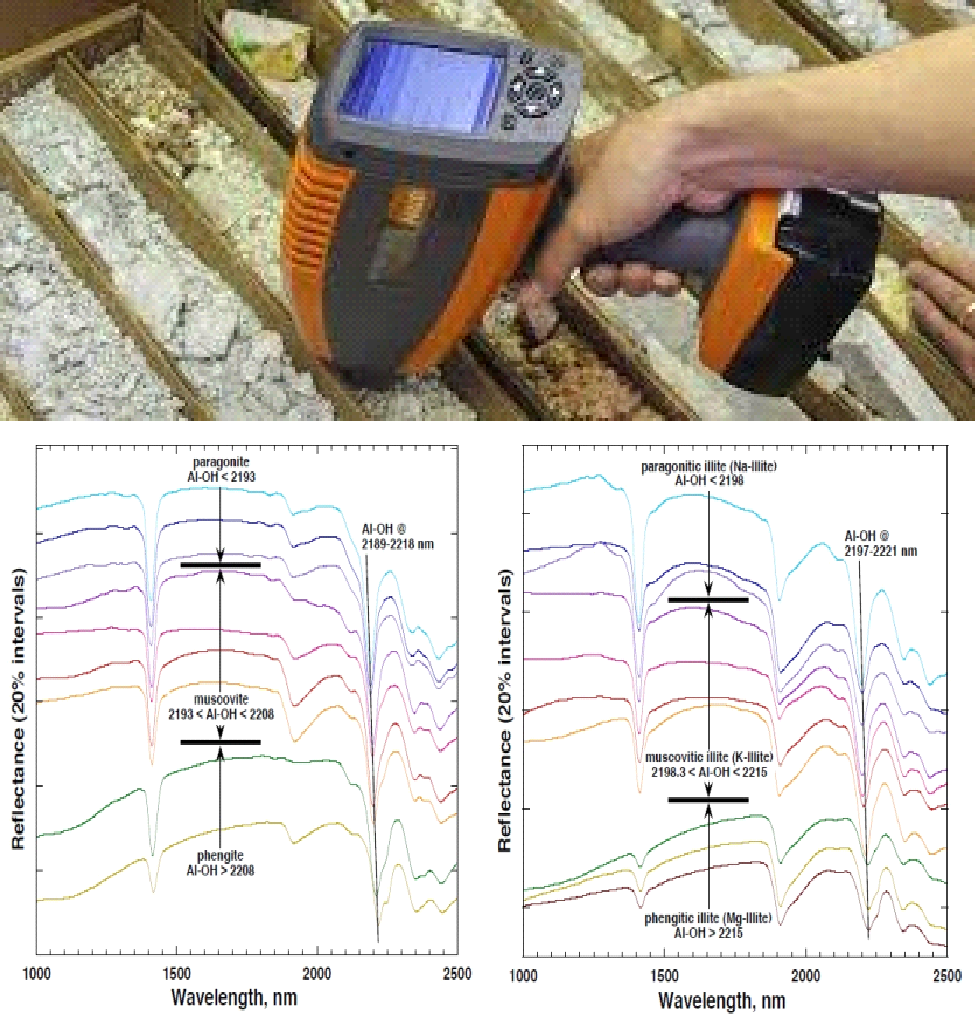
In general, strong characteristic NIR combination/overtone bands for the Al-OH, Mg-OH and Fe-OH species are observed between 2300-2100 and 1600-1250 nm (see Figure 2 below). These spectral features are differentiated due to differences in both the metal bond strength and the crystalline environment. Table 2 summarizes some of the more important features for NIR active functional groups. Select broad absorption features from electronic transitions are also observed at shorter wavelengths. This includes Fe+3 (hematite 870 nm, goethite 910 nm and jarosite 920 nm) as well as Fe+2 (pyroxene 1000 nm).
| Molecular Species | 1st Combination (nm) | 1st Overtone (nm) | 2nd Overtone (nm) | 2nd Combination (nm) |
| H2O | 1900 | 1400 | ||
| OH | 2500-2100 | 1670-1250 | ||
Fe-OH | 2295-2230 (2330) | |||
Mg-OH | 2360-2300 (2250) | |||
Al-OH | 2220-2160 (2200) | |||
| CO3- | 2350-2300 | 1990, 1870 | ||
| NH4+ | 2100, 2020 | 1560 |
Data analyses capabilities of vis-NIR reflectance for minerals
The vis-NIR instrument systems as supplied by the vendor have been optimized to include a multivariate data analysis tailored to the mineral application. The vendor supplied analyses modules include mineral species identification of 125 NIR active minerals as well as multivariate analysis based scalars.3 The ASD based system provides nine different scalars for the analysis of the sample mineralogy. This provides information on the mineral composition, crystallinity and geothermal conditions of formation. Table 3 summarizes these scalars and their functional application. Applications of gangue mineral concentration determination have also been reported by utilizing Partial Least Squares multivariate analysis techniques.2
| Scalar ID | Key attribute | Application |
| Al-OH | Geochemical conditions | Mica composition changes |
| Mg-OH | Geochemical conditions | Chlorite composition changes |
| Fe-OH | Geochemical conditions | Chlorite composition |
| Al-Fe-Mg | Track geochemical gradients | |
| Kx | Temperature of formation | Kaolinite crystallinity: weathering or temperature of formation |
| ISM (illite maturity) | Metamorphic grade illite | Formation events. Higher grade, less water |
| CSM (chlorite) | Metamorphic grade chlorites | Formation events. Higher grade, less water |
| Fe3t | Hydroxide/oxide type Fe+3 | Map oxidized zones |
| Fe3i | Fe+3 mineral abundance | Map iron ore deposits |
NIR spectroscopy Advantages and Limitations
| Advantages | Disadvantages |
| Flexible sampling (rock surfaces, drill cores, rock particulates). Remote sampling | Spectra exhibits particle size behavior. Particles must be > 0.1 mm |
| Excellent at identifying clays | Limited specificity. Excellent at identifying hydroxyl groups. Poor at many other mineral species (for example sulfides, silica, sulfates) |
| Inexpensive, portable, robust and simple to use instrumentation | Water interference |
| Mineral analysis models included for data analysis | Surface reflectance measurement (no bulk information) |
| Mature product >10 years in mineral applications | Detection limit for NIR active species (> 0.5%) |
References
- Viscarra Rossel, R.A., Cattle, S.R., Ortega, A., Fouad, Y., “In situ measurement of soil colour, mineral composition and clay content by vis-NIR spectroscopy” Geoderma 150 (2009) 253-266.
- Shankar, V., “Field Characterization by Near Infrared (NIR) Mineral Identifiers – A New Prospecting Approach” Procedia Earth and Planetary Sci 11 (2015) 198-203.
- Doublier, M.P., Roache, A., Potel, S., “Application of SWIR spectroscopy in very low-grade metamorphic environments: A comparison with XRD methods” ”, geological Survey of Western Australia, Record 2010/7, 61. Government of Western Australia, Dept of Mines and Petroleum.
- Goetz, A.F.H., Curtiss, B., Shiley, D.A., “Rapid gangue mineral concentration measurement over conveyors by NIR reflectance spectroscopy” Minerals Engin 22 (2009) 490-499.
- Iyakwari, S., Glass, H.J., Mineral preconcentration using near infrared sensor-based sorting.” Physicochem. Prbl. Miner. Process. 51(2), 2015, 661-674.
- Egana, A.F., Santibanex-Leal, F.A., Vidal, C., Diaz, G., Liberman, S., Ehrenfeld, A., “A Robust Stochastic Approach to Mineral Hyperspectral Analysis for Geometallurgy” Minerals 2020 , 10, 1139.
- der Meer, F.V., “Near-infrared laboratory spectroscopy of mineral chemistry: A review” Int J Appl Earth Obs Geoinformation 65 (2018) 71-78.
- Lorenz, S., Seidel, P., Ghamisi, P., Zimmermann, R., Tusa, L., Khodadadzadeh, M., Contreras, C.I., Gloaguen, R., “Multi-Sensor Spectral Imaging of Geological Samples: A Data Fusion Approach Using Spatio-Spectral Feature Extraction” Sensors 2019 (19) 2787.
- See Spectral Evolution, https://spectralevolution.com/.
- See Malvern ASD, https://www.malvernpanalytical.com/en/about-us/our-brands/asd-inc/