
Introduction
The role of microscopy in mineral processing
In order to select the best process scheme for a new ore, or to trouble-shoot effectively in an operating plant, an accurate identification of the minerals and their mode of occurrence is necessary. Mineral identification is accomplished using microscopy, physical, chemical and instrumental methods. Microscopy techniques examine ore prepared as loose grains, thin sections, and/or polished grain mounts. Some examples of why detailed mineral information is important to ore beneficiation are:
- Occurrence of the desired element in more than one mineral, particularly if the minerals have different responses to concentration. Examples: gold as native gold and gold in solid solution in pyrite; copper in chrysocolla and chalcopyrite; copper in chalcopyrite, malachite and Cu-bearing goethite; tin in cassiterite and frankeite.
- Variability in mineral composition (substitution, isomorphism). Examples: variability of Ag in solution in gold grains, high-Fe versus low-Fe content in sphalerite.
- The presence of gangue minerals that can have an adverse effect on beneficiation; eg. montmorillonite and talc.
- The presence of rare or unexpected minerals.
The determination of mineral textures and associations with other minerals can be either a qualitative, semi-quantitative, and/or quantitative analysis. In the latter case, the analysis involves the determination of the degree of liberation (at various grind sizes) of both the valuable and non-valuable minerals from each other. This information is essential to the selection, modification or operation of a particular beneficiation process. Some important features to look for are:
- Rims or coatings of one mineral around another. Examples include digenite/chalcocite rimming pyrite; pyrite around galena; pyrite with an inner rim of chalcocite and an outer rim of Cu-bearing goethite.
- Extremely fine, intimate intergrowths of two or more minerals (veining). Examples include ilmenite/magnetite/hematite; pentlandite/pyrrhotite; chalcopyrite/sphalerite; sphalerite/chalcopyrite/galena.
- Extremely fine inclusions of one mineral in another, such as 2 µm or less gold blebs in quartz; chalcopyrite blebs in sphalerite; fine chalcopyrite grains in magnetite.
- More than one mode of occurrence of a desired mineral. For example, free gold and fine gold inclusions in arsenopyrite; free chalcocite and chalcocite locked with siliceous gangue.
The above associations help to explain recovery difficulties; losses of valuable minerals in tails and non-valuable minerals in concentrates, and give a good indication if optimizing flotation conditions in some way could improve recovery. This section describes how optical microscopes and scanning electron microscopes are used. The use of SEM with back-scatter detectors (BSD), energy dispersive X-ray detectors (EDX or EDS), and auto-mated software such as minerals liberation analysis (MLA) is also included.
Optical Microscopy
Use of a stereoscopic microscope is a vital first step in the mineralogical examination of samples of crushed and ground ores, and of laboratory and mill products. The image is three-dimensional, and physical and crystallographic features are the same as those seen on coarser minerals with the naked eye. Some minerals can be readily recognized by such properties as color, luster, crystal habit, cleavage, fracture, transparency, and magnetic behavior. The microscope has considerable working distance between the lower lens and the object to permit manipulation of grains and simple physical and chemical tests. Free minerals can be picked out by needle or forceps for separate tests. Grain sizes can be measured by the use of scales mounted in one of the eyepieces. Coarse locking between minerals can be observed and followed in a series of decreasing size fractions. Identification of unrecognized or partially obscured minerals is usually difficult unless they can be manipulated to produce easy diagnostic test results. In addition to permitting an overall view of the mineral assemblage, the stereoscopic examination can indicate the desirability, direction, and scope of further investigation. It is often beneficial to subdivide the sample into two or more fractions using size, magnetic susceptibility, gravity, or other physical fractions to obtain products which need more critical evaluation by other techniques. Chemical methods are also useful. An acid-insoluble residue may provide information not easily available otherwise. These separations may be qualitative or quantitative, as the case requires. All granular products of these separations should be examined under the stereoscopic microscope for identification.
In the petrographic microscope, the light is collimated by the condenser into a bundle of beams, all parallel to the optical aids of the microscope. The light beams are polarized in one direction (by the polarizer) before the light reaches the specimen. This light is called plane polarized light. The petrographic microscope can be used to identify transparent minerals, which constitute the great majority of all minerals. Opaque minerals are seen in silhouette. The microscope is used in examinations of thin sections and loose grains in very thin layers. The thin sections are about 30 microns thick and are made from slices of rock, ore, or in some cases, plastic with embedded fragments. Loose grains are mounted in oils or similar media. Oils are usually of known index of refraction for comparison with those of transparent minerals. Usually a series of mounts is made with different reference oils to match or bracket the indices of refraction of various minerals. All of these preparations are made on microscope slides and covered with a thin cover glass. For more information on the techniques of petrographic microscopy, the reader is referred to the books and articles listed in the bibliography.
The ore microscope is the basic instrument for the petrographic examination of the large and economically important group of minerals referred to collectively as "ore" or "opaque" minerals. The microscope uses reflected and polarized light. The ore microscope can handle the microscopically opaque minerals and several minerals which are called “semi-opaque.” The “semi-opaque” minerals include such common ore minerals as sphalerite, cuprite, hematite, proustite, and pyrargyrite, which are usually studied under the ore microscope because of their associations with more opaque minerals. Under an ore microscope, the mineralogist examines polished surfaces of ore fragments and mineral grains. In most cases, these objects have been cast in plastic briquettes, which after hardening are abraded to a plane surface and polished to a mirror finish. Care must be taken that the polished surface is perpendicular to the axis of the microscope during examination. Minerals are identified on the basis of reflected color, reflectivity, polishing hardness, internal reflection (if any), cleavage, crystal habit, and optical properties of the mineral surface in the presence of polarized light. With a micro hardness tester, indentation hardness numbers may be obtained by measuring a critical dimension of an impression made in a mineral surface by a shaped diamond under a known load. Relative reflectivities may be judged by eye by comparison with those of several common minerals such as pyrite, galena, tetrahedrite, sphalerite, and magnetite. There also are useful accessories for quantitatively measuring the reflectivities of polished mineral surfaces at three different wavelengths of light. These classic optical microscopy techniques are less common with the advent of a scanning electron microscope equipped with an energy dispersive X-ray detector (SEM/EDX). Nonetheless, if these are properly done, the tests can be quick and decisive.
SEM/EDX
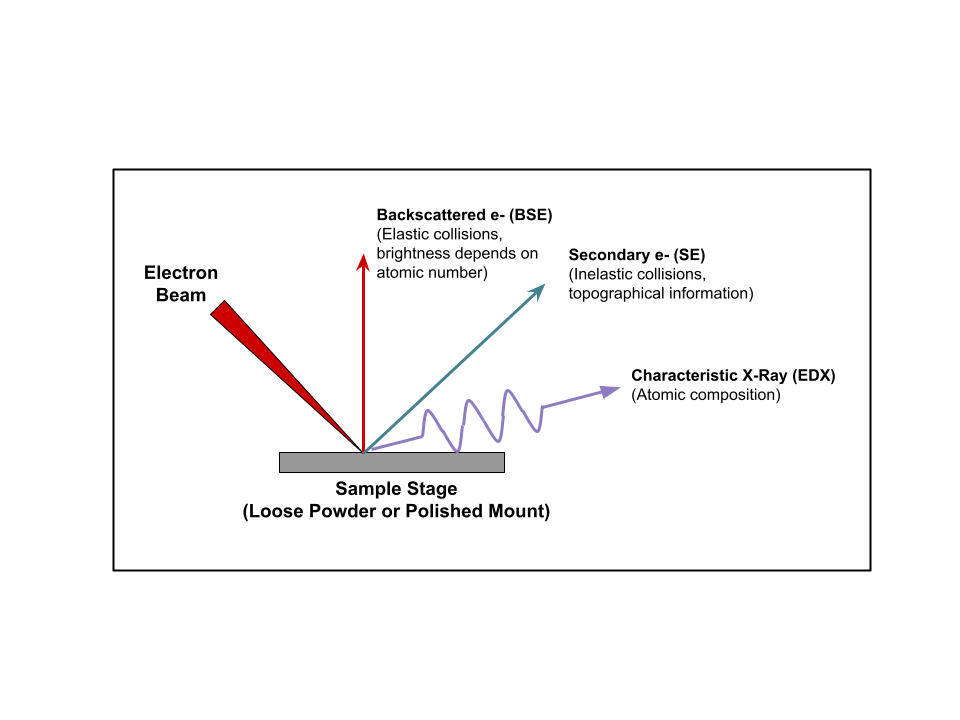
Scanning Electron Microscopy/Energy Dispersive X-Ray spectroscopy (SEM/EDX) has been proven to be a vital tool in the characterization of Mining ores. Scanning Electron Microscopy enables the investigation of a sample over a wide range of scales, going from a fraction of a nanometer up to several hundreds of micrometers. A beam of high-energy electrons scans the sample surface. Depending on the electron-matter interactions, this will lead to the emission of various types of radiations such as:
- Secondary electrons (SE detector), which provides topographical information ideal for morphology.
- Backscattered electrons (BSD), which provides chemical information of the sample surface (Z contrast)
- EDX spectra, shows peaks corresponding to the elements making up the true composition of the mineral being analyzed.
Backscatter images are useful because high Z contrast or atomic number species such as Au and Ag appear very bright making it very easy to find in ores where the level is very low. Likewise mid-level Z contrast species such as chalcopyrite and sphalerite are medium bright, while low Z contrast species like non-sulfide gangue appear dark gray and organics black.
In an SEM, it is also possible to perform semi-quantitative elemental analysis by collecting characteristic X-Rays by EDX (Energy Dispersive Spectroscopy, also called EDS), or WDS (Wavelength Dispersive Spectroscopy). Energy dispersive X-ray provides an elemental analysis of minerals containing elements with atomic numbers from beryllium to uranium. When the electron beam bombards a sample, X-rays, characteristic of each element, are emitted. A beam of electrons (as small as 1 micron in diameter) can be focused on a selected point or it can be made to scan a small field used to determine the silver content of gold grains, the substituent elements in sphalerite or tennantite, or an analysis of a fine inclusion. It can also map the distribution of specified elements.
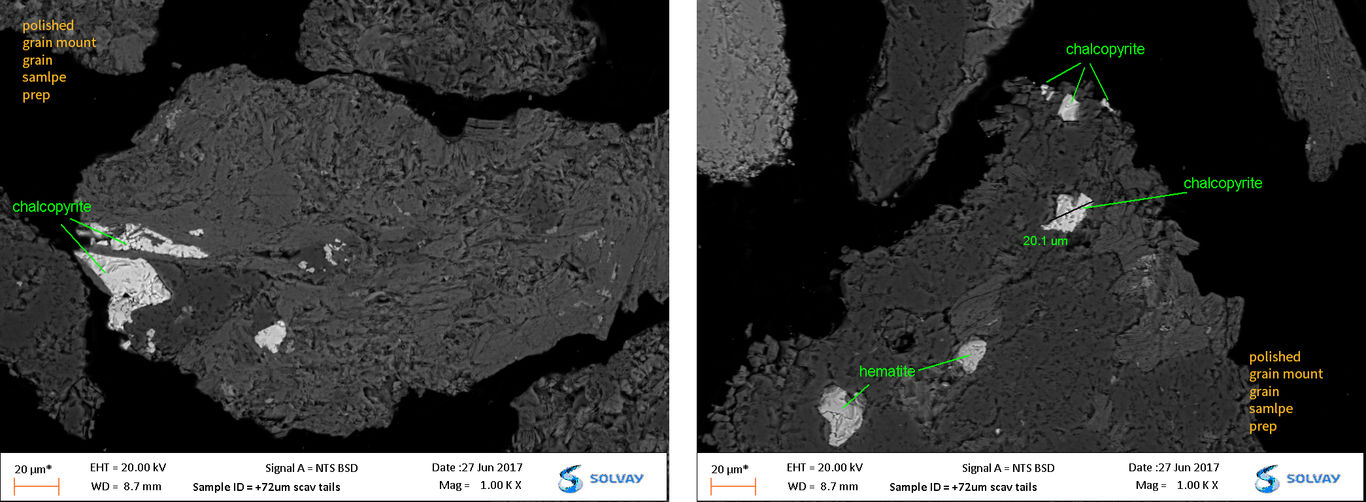
Below are examples showing the benefits of SEM/EDX without the use of automation such as MLA (Mineral Liberation Analyzer):
- Loose grain sample preps to emphasize the benefits of morphology using the SE detector. The use of high resolution SEM on polished grain mount samples using the back scatter detector.
- The use of the backscatter detector at very high magnification to locate copper losses in small fraction tails.
- The use of EDX mapping to showcase veining and rimming and EDX mapping showing similar average molecular weight species which are difficult to differentiate with the use of the backscatter detector alone.
The characteristics of these examples often provide difficulties in the flotation process. They are also missed in most automated systems such as MLA.
Sample prep - Ore samples consist of feed, concentrate, and/or tails depending on the objective of the analysis. All are fractionated into particle size ranges using a manual wet sieve procedure. Fractions are embedded in epoxy resin and polished using a variable speed grinder-polisher; these samples are referred to as “polished grain mounts”. This prep, however, does not allow for detection of the morphology of a sample given that, during polishing, fibrous, or platy particles can be cross-cut as shown in the inset of Figure 2 and thus information about their morphology is lost. Therefore, loose grain sample preps are used in order to evaluate a sample’s morphology. Figures 1-3 show examples of the advantages of using loose grain samples over polished grain mounts.
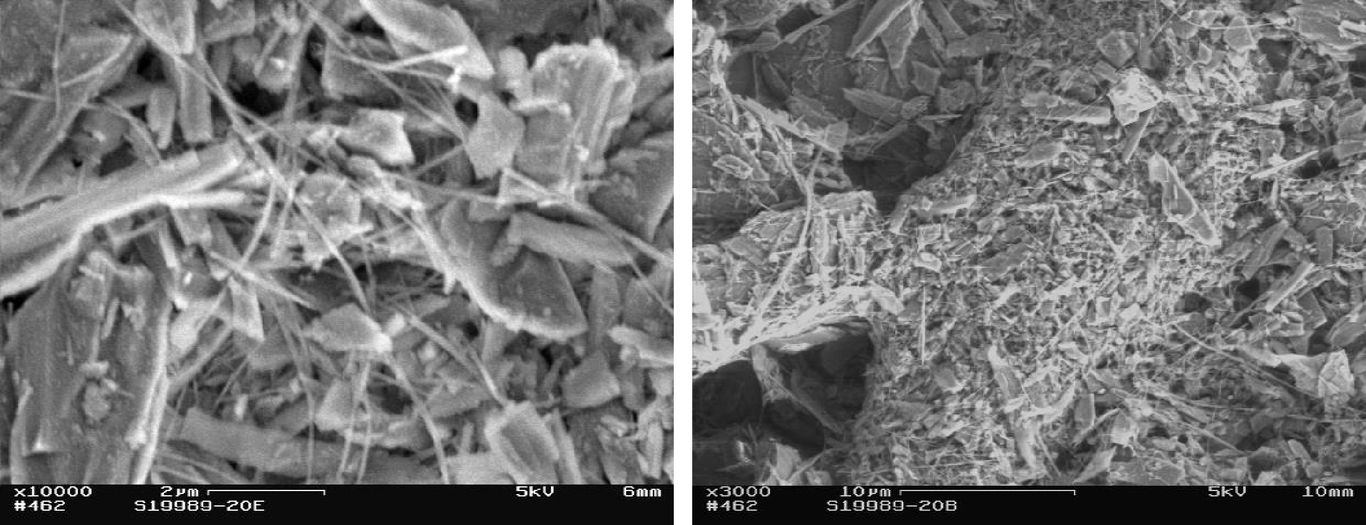
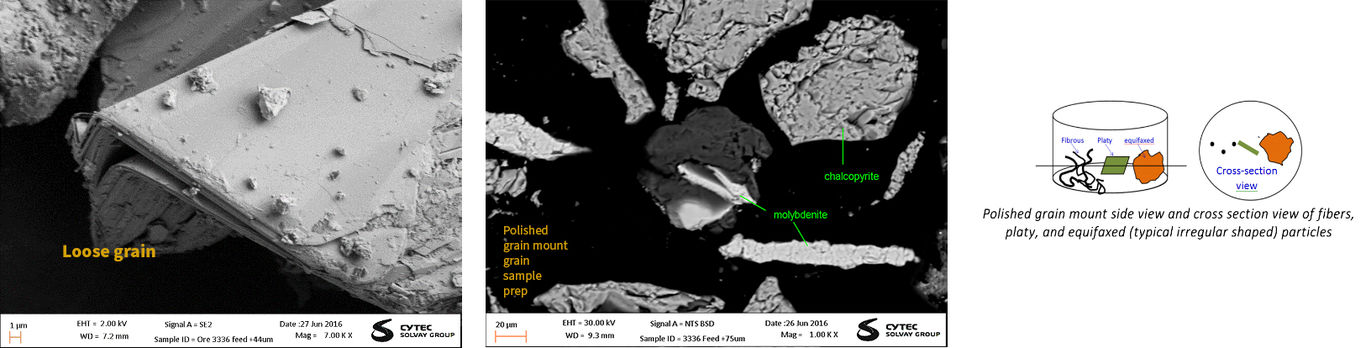
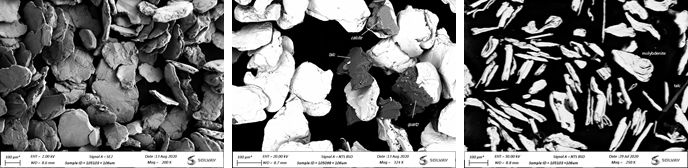
Above are three SEM images of a high grade molybdenite concentrate +106 micron fraction. The first two preps are a loose grain sample prep while the third image is a polished grain mount. The 1st image is taken at low voltage using the SE detector which provides more details of the morphology, the 2nd image is taken at much higher voltage using the BSD detector which provides Z contrast differences which makes it easy to detect talc (also platy). The 3rd image shows how the talc and molybdenite can have the same shape in cross-section. Note that automated systems of this type of morphology can be under-represented in quantitation.
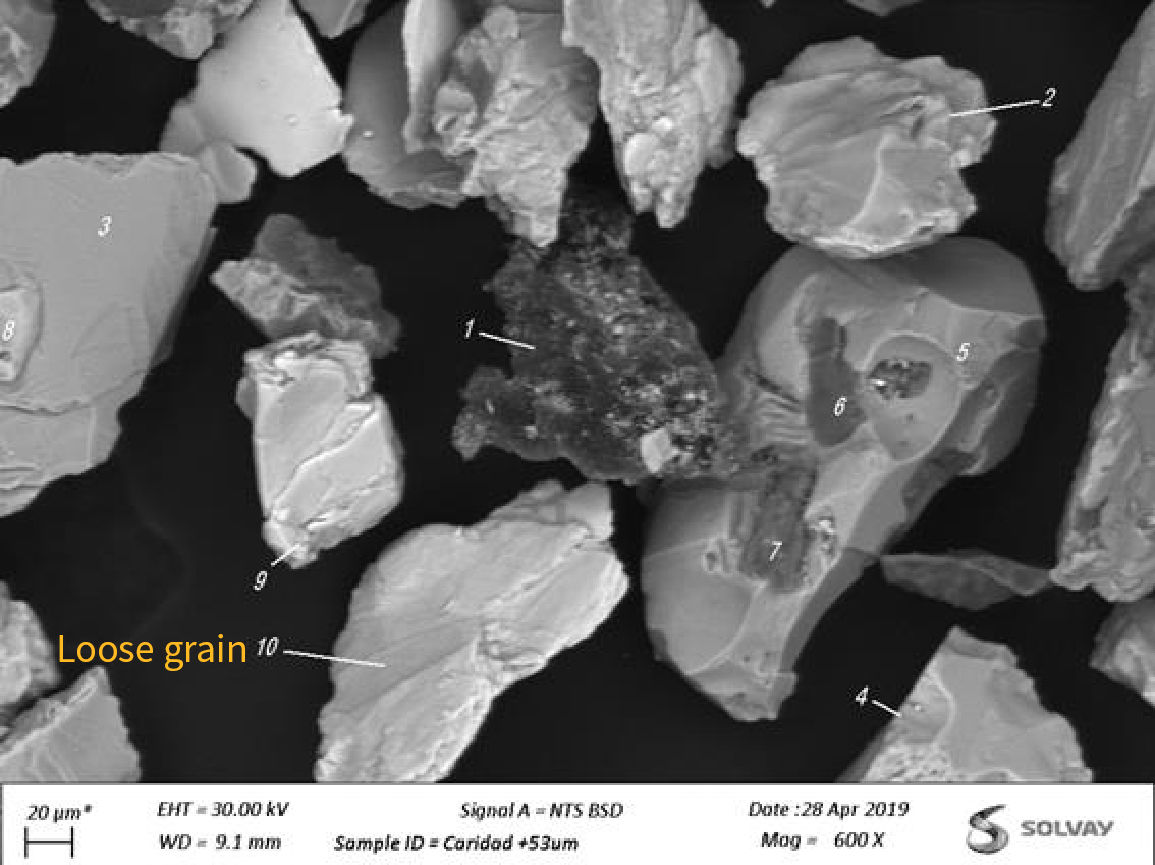
1-graphite, 2, 4, 8-chalcopyrite, 6, 7-muscovite, 9, 10-molybdenite. Backscatter detector with species confirmed by EDX.
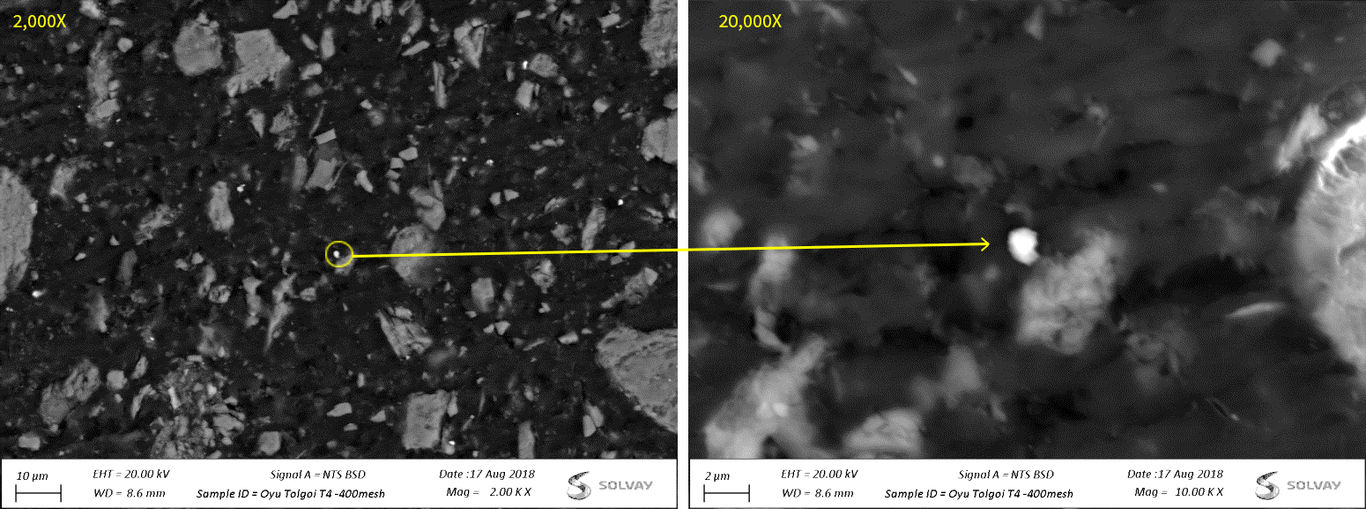
SEM/EDX with EDX further enhances capabilities;
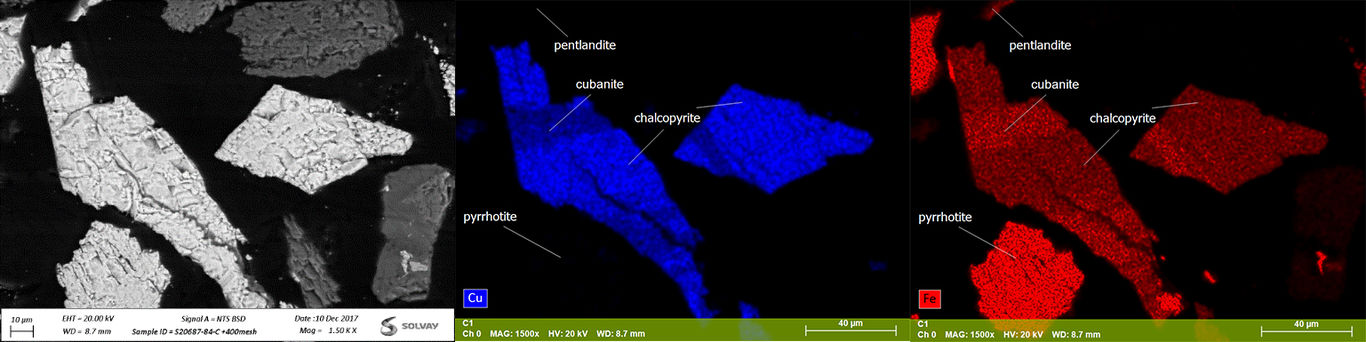
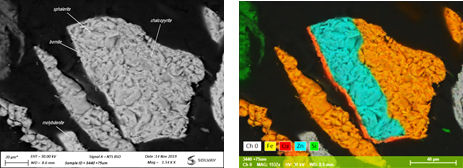
Here is another example of successful use of EDX mapping when backscatter detector is no sufficient. The average atomic number (Z contrast) for sphalerite (ZnS), chalcopyrite (CuFeS2), and bornite (Cu5FeS4) are similar so the brightness of the multiphase grain shows no distinction of the three minerals present. The overlay of Cu and Fe show a deeper orange color for the bornite which contains more copper than chalcopyrite.
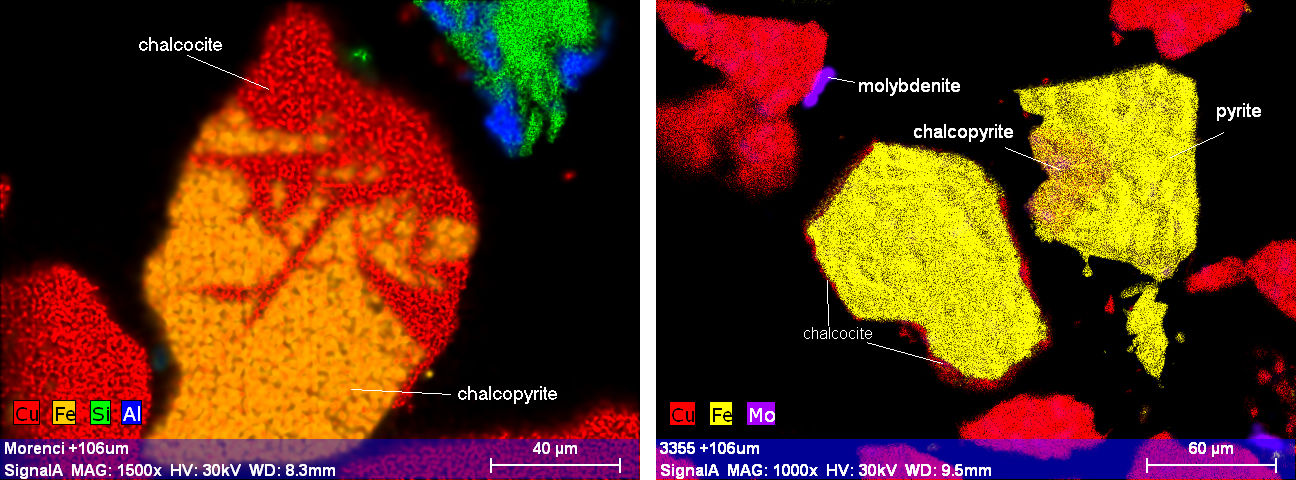
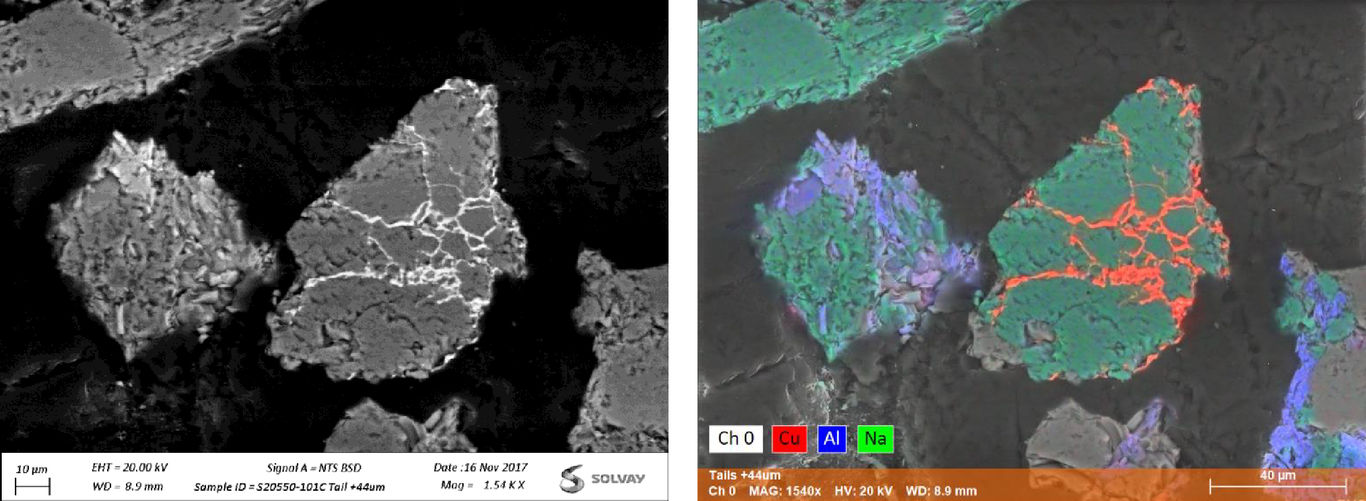
The most basic of SEM configurations for mineralogy is SE detector, BSD, and EDX. However, it is worth mentioning that SEM’s can be equipped with an array of detectors such as an Electron Backscatter Diffraction detector (EBSD) which can provide crystallographic information about the microstructure of a sample, or an XRF detector. This technique in itself is no doubt extremely powerful for minerals processing. However, there are some limitations:
- Samples must be in solid state to undergo X-rays and be stable under vacuum.
- EDX spectra collected cannot detect very light elements such as H or He.
- The spot size for EDX spectra collection is ~1micron so collection on much smaller particles will have interferences from neighboring particles making it not possible to collect a “clean” spectra.
- SEM/EDX is not a “bulk” analysis so analyzing ~1,000 particles or less per sample may not be representative of the bulk when looking for ppm levels of species present.
- EDX spectra cannot distinguish between species of very similar molecular formulas or the same molecular formula such as rutile and anatase which have the same molecular formula (TiO2). Hematite and magnetite are also difficult because of the inability to collect a ‘clean” spectra because of contaminants and neighboring minerals.
Automated SEM / EDX (MLA)
SEM/EDX with mapping capabilities is enhanced even more with automated techniques for quantitative image Analysis. Commercially available lab-based solutions include QEMSCAN (Quantitative Evaluation of Materials by Scanning Electron Microscopy) software package and MLA (Mineral Liberation Analyzer) from FEI Company, Mineralogic from Zeiss, INCAMineral from Oxford Instruments, the TIMA (Tescan integrated mineral analyzer) from TESCAN and AMICS from Bruker. All are capable of the following:
- Bulk modal analysis
- Particle maps
- Locked and liberated textural analysis
- Size-by-size, mineral-by-mineral chemical assay
- Trace mineral hunt and search capabilities, ppm levels.
Viewing software allows the user to analyze particle maps and determine:
- Grains and particle size
- Shape factor
- Particle type
- Proportion of mineral species present
- Isolate sub-sets of particles with the creation of particle characteristic screens
The automated software packages and partnerships with SEM and EDX manufacturers are constantly evolving. However many of the systems are still in use long after the purchasing configurations are available. There are some application notes and information on some of the systems in the Reference section below for the reader’s convenience.
Advantages and Limitations of Microscopy Techniques
| Advantages | Limitations/Disadvantages |
Stereomicroscope:
| Stereomicroscope:
|
Ore microscope:
| Ore microscope:
|
SEM/EDX
| SEM/EDX
|
References
| Webpage: FEI MLA | Webpage: Zeiss Mineralogic |
| FEI- MLA Brochure | |
| Webpage: Bruker AMICS | Webpage: TIMA TESCAN |
| AMICS Webinar | TESCAN Automated Mineralogy |